Friday, March 28, 2014
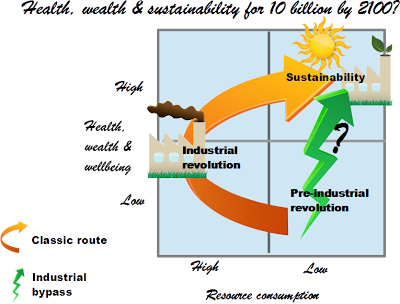
Paths to sustainability
Thursday, February 13, 2014
World GDP/capita and energy efficiency - base case - wealth convergence by 2100
Here I'll develop a 'wealth convergence' scenario to act as a base case:
- GDP/capita in Europe grows at the same annual rate between 2010 and 2100 as it did between 1870 and 2000. The analysis by Broadberry and Klein (1911) gives GDP/capita growth rates (% per year) as follows:
Northwestern (NW) includes Scandinavia, Benelux and the UK; Southern (S) covers countries bordering the Mediterranean including Turkey plus Portugal; Central and Eastern (C&E) includes Austria, Germany, Switzerland, Poland and the USSR.Region 1870-1913 1913-1950 1950-1990 1990-2000 NW 1.03 0.95 2.47 2.19 S 1.15 0.73 3.39 1.57 C&E 1.12 0.79 2.55 -0.47 Total 1.08 0.82 2.72 0.96
Since 1870 there have been times of boom and bust, of war and peace but there has been an increase in GDP per capita over the 130 years for all Europe which averages out at 1.5% per year. This is the figure that will be assumed for the remainder of the 21st century. - Every nation converges on European GDP/capita by 2100. This implies a slowing in the rate of growth of GDP in the USA compared to Europe but is unlikely to introduce serious errors for global GDP which by 2050 will be dominated by Asia who will be joined by Africa by 2100.
- The trend in energy efficiency that was achieved by the USA in the last 200 years is achieved by all nations and maintained throughout the 21st century. The evidence from my posting on 16 January 2014 shows that between 1795 and 2005 the USA increased GDP/capita by a factor of 40 whilst increasing energy efficiency by a factor of 20. For my base case I will assume that this rate of improvement in both parameters will be sustained by all nations throughout the 21st century.
R/R0 = (W/W0)0.8 where R is GDP/Mtoe and W is GDP/capita
Thursday, January 30, 2014
Global carbon emissions


China has already overtaken the USA as the biggest emitter and is continuing to steadily increase emissions. The big question is whether China will be able to hold its per capita emissions at the UK level or will follow the USA. Either way it's populations and their aspiration to be as wealthy as the West which will be driving emissions.
Wednesday, January 22, 2014
Climate change: challenges & solutions - plumbing the depths of my ignorance
I'm still confused by our ability to use a single temperature to characterise global climate.
I'll start with the last 50 years which has used very sophisticated ground and satellite based techniques for measuring the weather. Put simply I don't understand what methods have been used for averaging over the Earth's surface. Taking an extreme case: how are temperatures in the Himalayas accommodated? Do they contribute according to the area exposed to the atmosphere because that would be most appropriate for heat transfer and sublimation? Or is the area taken simply as that on a map, i.e. projected area? And if the latter, what allowance if any is made for altitude?
And tree rings presumably provide evidence on temperature and rainfall in the growing season but what assumptions have to be made about the rest of the year?
Ice cores go back millennia and provide evidence on relatively long periods of time so what assumptions are made about the variability within those periods?
Good discussions of these matters at: UEA FAQs and on the NASA Goddard Institute for Space Studies pages. Also some explanations at the latter site about how data from ice cores, tree rings etc etc are consolidated.
Thursday, January 16, 2014
Poorest countries are not most energy efficient!!

This seems to suggest that there is some sort of 'boomerang' effect in which the least wealthy (least productive) countries generate the greatest economic return on energy consumed, i.e. the poorest seem to be the most highly energy efficient. Increasing wealth seems to be related to a reducing return on energy employed until reaching those countries where individuals are at least moderately wealthy (productive) at which point increasing wealth is associated with an increasing return on energy consumed.
Rather than a real effect is it possible that the 'boomerang' is caused by some artefact of the data being analysed? Wood is omitted from most energy budgets and this can be a major source of energy in some economies. For example, consider the USA from 1790 to 2006:
Once wood is accounting for it seems that the boomerang effect disappears and the US has been steadily increasing individual wealth while improving energy effectiveness, i.e. increasing the return on energy consumed.
What about a country like Bangladesh?
It seems that once wood is included in the energy consumption Bangladesh is not quite so highly energy efficient as we might have thought. Not only that but it exhibits the same trend of increasing individual wealth with improving the return on energy consumed.
So the poorest countries do not achieve the greatest return on energy consumed; increasing individual wealth is instead associated with increasing efficiency of energy use!
A few definitions
- Energy demand (E) =
Population (P) x Wealth (W) x Return (R) - Wealth is GDP/person.
- Return is the GDP returned for each unit of energy employed.
- America
- Europe
- Africa
- Asia
My next post will consider a misconception about the efficiency with which energy generates a return in GDP.

